Forum for asking and answering questions related to use of the OpenSeesPy module
Moderators: silvia, selimgunay, Moderators
-
kolebron
- Posts: 7
- Joined: Mon Apr 11, 2022 6:56 pm
Post
by kolebron » Tue Jul 05, 2022 2:19 am
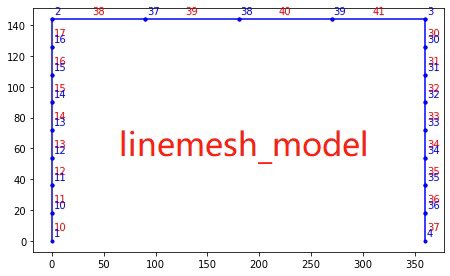
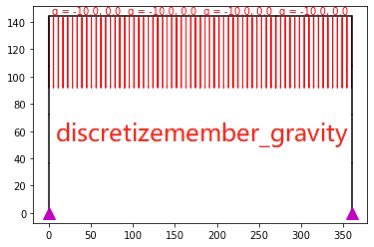
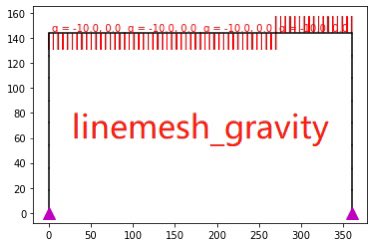
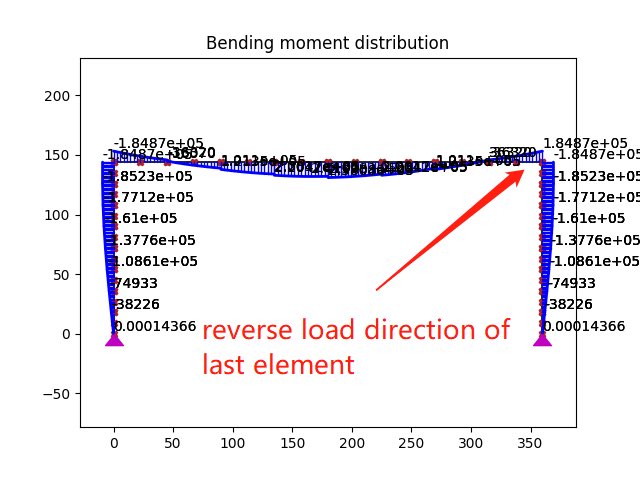
Hello, everyone. Recently, when I used the Linemesh command and DiscretizeMember command, I found that when I used the linemesh command discrete component for gravity analysis, there seemed to be some problems with the direction of the last element. Please see the picture for details. I show an example here as a verification. Does anyone know what is going on here?

code:
- import openseespy.opensees as ops
import openseespy.preprocessing.DiscretizeMember as dm
import opsvis as opsv
import matplotlib.pyplot as plt
H = 360
L = 144
ops.wipe()
ops.model('basic','-ndm',2,'-ndf',3)
ops.node(1,0,0); ops.fix(1,1,1,1)
ops.node(2,0,L)
ops.node(3,H,L)
ops.node(4,H,0); ops.fix(4,1,1,1)
E = 29000
# W14x90
ops.section('Elastic',1,E,26.5,999)
ops.beamIntegration('Legendre',1,1,2)
# W18x76
ops.section('Elastic',2,E,22.3,1330)
ops.beamIntegration('Legendre',2,2,2)
# Corotational transformation
ops.geomTransf('Corotational',1)
# Number of elements/member
Nele = 4
# Columns
dm.DiscretizeMember(1,2,Nele,'dispBeamColumn',1,1,10,10)
dm.DiscretizeMember(3,4,Nele,'dispBeamColumn',1,1,30,30)
# Beam - storing and printing the return values for demonstration
elems,nodes = dm.DiscretizeMember(2,3,Nele,'dispBeamColumn',2,1,50,20)
# ops.mesh('line', 2, 2, *[2, 3], 0, 3, 90, 'dispBeamColumn', 1, 1)
opsv.plot_model()
plt.figure()
plt.show()
print(f'Beam nodes: {nodes}')
print(f'Beam elements: {elems}')
ops.timeSeries('Linear', 1)
# define Load Pattern
ops.pattern('Plain', 1, 1)
QdlBeam = 10.
# elems = [38, 39, 40, 41]
ops.eleLoad('-ele', *elems, '-type', '-beamUniform', -QdlBeam)
Tol = 1.0e-4
NstepGravity = 10
DGravity = 1. / NstepGravity
ops.wipeAnalysis()
ops.constraints('Plain')
ops.numberer('Plain')
ops.system('BandGeneral')
ops.test('EnergyIncr', Tol, 200)
ops.algorithm('KrylovNewton')
ops.integrator('LoadControl', DGravity)
ops.analysis('Static')
ops.analyze(NstepGravity)
opsv.plot_supports_and_loads_2d()
plt.show()
sfac = 1
-
mhscott
- Posts: 874
- Joined: Tue Jul 06, 2004 3:38 pm
- Location: Corvallis, Oregon USA
-
Contact:
Post
by mhscott » Thu Jul 07, 2022 11:29 am
What versions of openseespy and opsvis are you using?
-
kolebron
- Posts: 7
- Joined: Mon Apr 11, 2022 6:56 pm
Post
by kolebron » Tue Jul 12, 2022 5:46 pm
mhscott wrote: ↑Thu Jul 07, 2022 11:29 am
What versions of openseespy and opsvis are you using?
hello, prof. here is the program version I use:
openseespywin-3.4.0.1.1
opsvis-0.96.7
-
mhscott
- Posts: 874
- Joined: Tue Jul 06, 2004 3:38 pm
- Location: Corvallis, Oregon USA
-
Contact:
Post
by mhscott » Wed Jul 13, 2022 5:20 am
Upgrade to the latest version of opsvis and try again.
-
kolebron
- Posts: 7
- Joined: Mon Apr 11, 2022 6:56 pm
Post
by kolebron » Wed Jul 13, 2022 9:11 pm
mhscott wrote: ↑Wed Jul 13, 2022 5:20 am
Upgrade to the latest version of opsvis and try again.
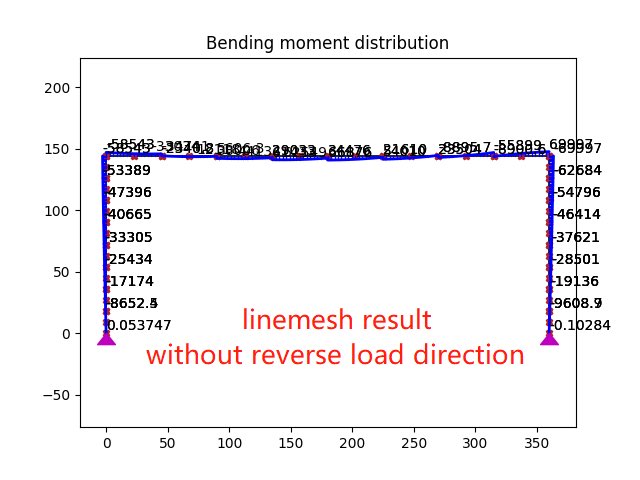
Hey, Professor, after testing, I found that it is not the problem of image display. When you manually reverse the load of the last element of the component divided by the linemesh command, you can get the correct result similar to the discretizemember command.

-
mhscott
- Posts: 874
- Joined: Tue Jul 06, 2004 3:38 pm
- Location: Corvallis, Oregon USA
-
Contact:
Post
by mhscott » Thu Jul 14, 2022 8:36 am
Please post an updated script that is consistent with the plots you show. For example, the script has fix 1 1 1 for the supports but plot_model shows pins. I know this is not the issue, but I'm not assured I'm working with the most up to date script.
-
kolebron
- Posts: 7
- Joined: Mon Apr 11, 2022 6:56 pm
Post
by kolebron » Thu Jul 14, 2022 9:30 pm
mhscott wrote: ↑Thu Jul 14, 2022 8:36 am
Please post an updated script that is consistent with the plots you show. For example, the script has fix 1 1 1 for the supports but plot_model shows pins. I know this is not the issue, but I'm not assured I'm working with the most up to date script.
Only beam members are used to compare the two division methods. If "-QdlBeam" in "ops.eleload ('-ele', 315,'-type','-beamuniform', QdlBeam)" is changed to "QdlBeam", a seemingly reasonable result will be obtained.
- import openseespy.opensees as ops
import openseespy.preprocessing.DiscretizeMember as dm
import opsvis as opsv
import matplotlib.pyplot as plt
H = 360
L = 144
ops.wipe()
ops.model('basic','-ndm',2,'-ndf',3)
ops.node(1,0,0)
ops.node(2,0,L)
ops.node(3,H,L)
ops.node(4,H,0)
ops.fix(1,1,1,0)
ops.fix(4,1,1,0)
E = 29000
# W14x90
ops.section('Elastic',1,E,26.5,999)
ops.beamIntegration('Lobatto',1,1,3)
# W18x76
ops.section('Elastic',2,E,22.3,1330)
ops.beamIntegration('Lobatto',2,2,3)
# Corotational transformation
ops.geomTransf('Corotational',1)
# Number of elements/member
Nele = 8
# Columns
# DiscretizeMember(ndI,ndJ,numEle,eleType,integrTag,transfTag,nodeTag,eleTag)
dm.DiscretizeMember(1,2,Nele,'forceBeamColumn',1,1,100,100)
dm.DiscretizeMember(3,4,Nele,'forceBeamColumn',1,1,300,300)
# Beams
# --------if DiscretizeMember--------
# elems,nodes = dm.DiscretizeMember(2,3,Nele,'forceBeamColumn',2,1,500,200)
#--------if linemesh--------
# ("mesh",tag Npts nodes type dofs size eleType transfTag beamIntTag)
ops.mesh('line', 2, 2, *[2, 3], 1, 3, 45, 'forceBeamColumn', 1, 1)
ops.timeSeries('Linear', 1)
# define Load Pattern
ops.pattern('Plain', 1, 1)
QdlBeam = 20.
#--------if linemesh--------
elems = [308, 309, 310, 311, 312, 313, 314]
ops.eleLoad('-ele', *elems, '-type', '-beamUniform', -QdlBeam)
ops.eleLoad('-ele', 315, '-type', '-beamUniform', -QdlBeam)
# --------if DiscretizeMember--------
# ops.eleLoad('-ele', *elems, '-type', '-beamUniform', -QdlBeam)
Tol = 1.0e-4
NstepGravity = 10
DGravity = 1. / NstepGravity
ops.wipeAnalysis()
ops.constraints('Plain')
ops.numberer('Plain')
ops.system('BandGeneral')
ops.test('EnergyIncr', Tol, 200)
ops.algorithm('KrylovNewton')
ops.integrator('LoadControl', DGravity)
ops.analysis('Static')
ops.analyze(NstepGravity)
sfacN, sfacV, sfacM = 5.e-5, 5.e-5, 5.e-5
opsv.plot_model(node_supports=True)
plt.title('model')
opsv.plot_loads_2d()
plt.title('load')
opsv.section_force_diagram_2d('N', sfacN)
plt.title('Axial force distribution')
opsv.section_force_diagram_2d('M', sfacM)
plt.title('Bending moment distribution')
plt.show()
ops.wipe()