![]()
![]()
![]()
|
|
|
|
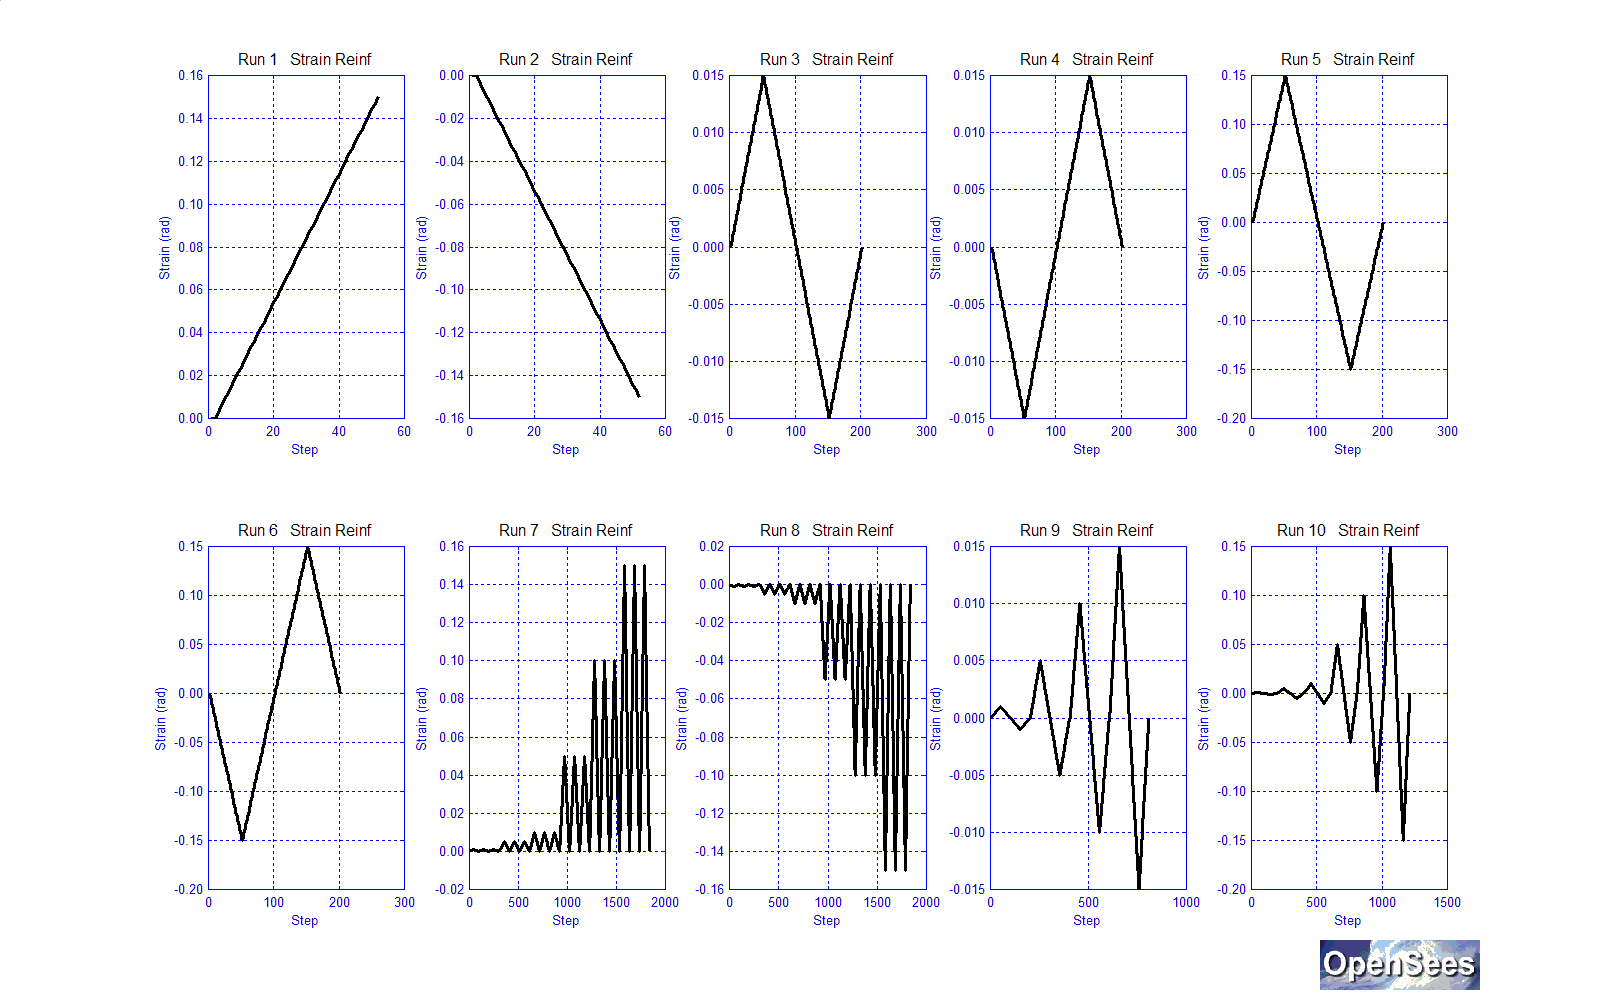
The concrete and steel materials were subjected to similar strain cycles. The patterns of the cycles were the same, but the amplitudes were different (reinforcing steel typically reaches maximum strains of 10%, while concrete reaches maximum strains of 6% with nonzero stresses).
Then different loading patterns were imposed on the materials, as follows:
These strain histories are tabulated below and shown graphically in the two figures below for concrete and for reinforcing-material, respectively.
Table 1. Strain histories
Run |
Concrete Material |
Steel Material |
1 |
+0.010 |
+0.20 |
2 |
-0.035 |
-0.20 |
3 |
+0.005, -0.005 |
+0.02,-0.02 |
4 |
-0.005, +0.005 |
-0.02,+0.02 |
5 |
+0.05,-0.05 |
+0.2,-0.2 |
6 |
-0.05,+0.05 |
-0.2,+0.2 |
7 |
+0.00005,+0.00025,+0.0005, +0.0025,+0.005,+0.0075,+0.01 |
+0.0005,+0.001,+0.005,+0.05,+0.10,+0.15,+0.20 |
8 |
-0.00005,-0.00025,-0.0005, -0.0025,-0.005,-0.0075,-0.01 |
-0.0005,-0.001,-0.005, -0.05,-0.10,-0.15,-0.20 |
9 |
+-0.00005,+-0.00025,+-0.0005, +-0.0025 |
+-0.001,+-0.005,+-0.01, +-0.02 |
10 |
+-0.00005,+-0.00025,+-0.0005, +-0.0025,+-0.005,+-0.0075, +-0.01 |
+-0.001,+-0.005,+-0.01, +-0.02,+-0.05,+-0.10, +-0.15,+-0.20 |
Figure 1. Concrete-Material Strain History:
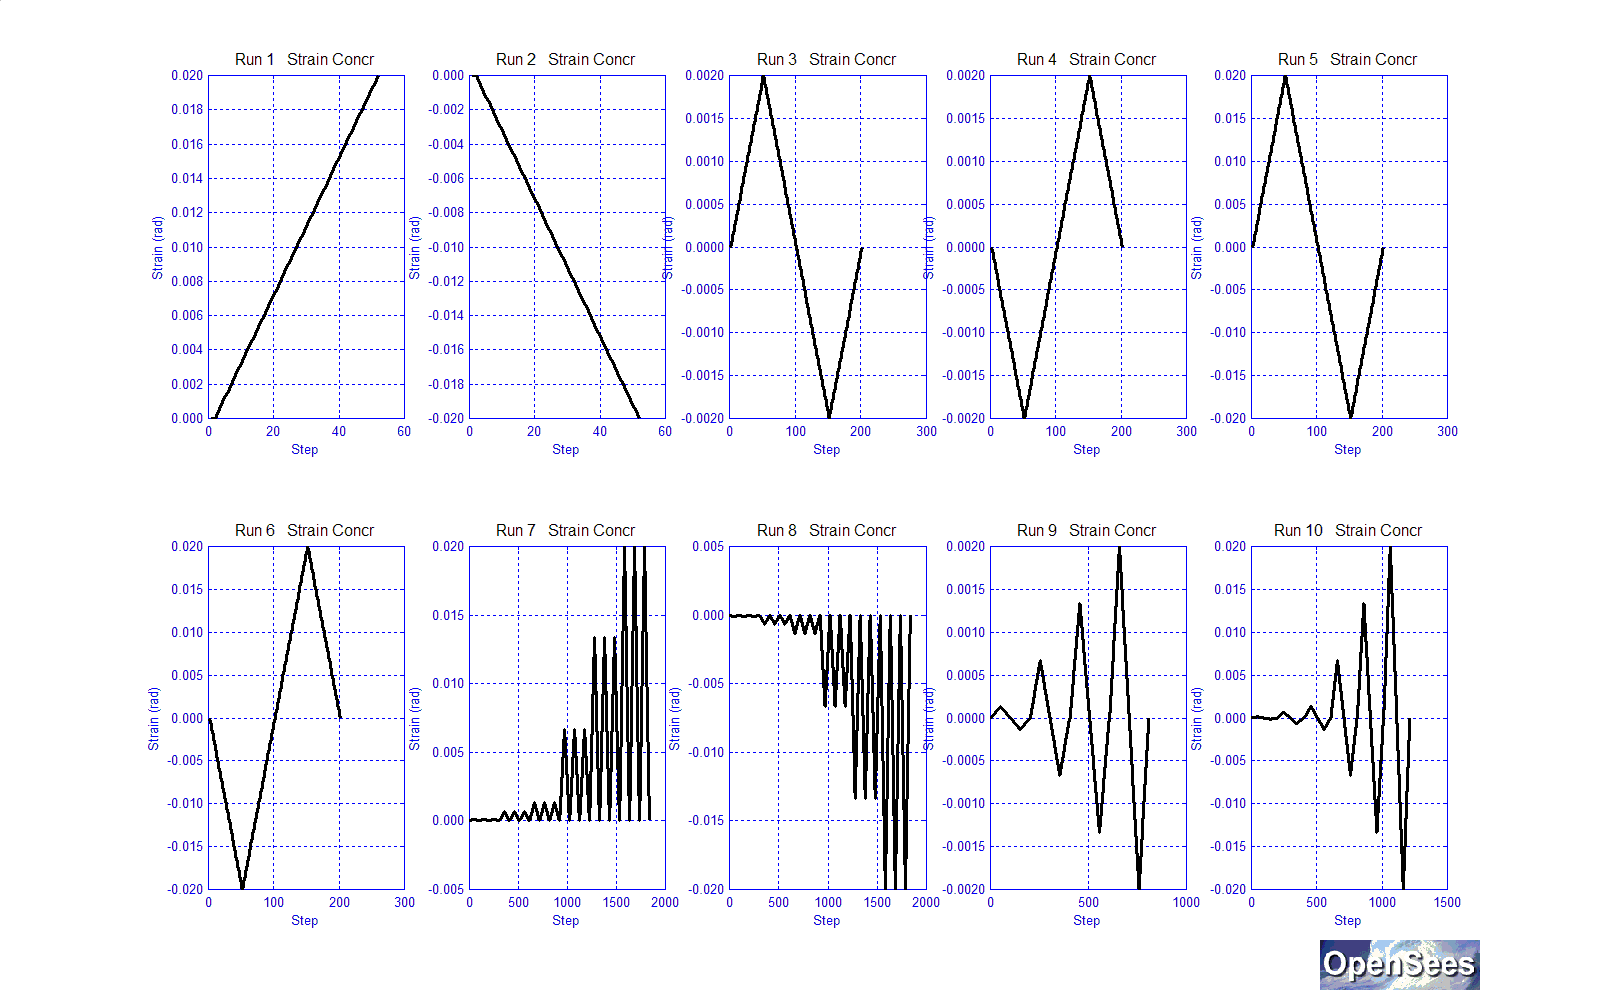
Figure 2. Steel-Material Strain History:
|
|
|